


Microsoft Power BI is one of the most popular BI tools on the market, and offers numerous ways to process and visualize data. For even greater flexibility, you can also extend standard functions extensively by using Python and R scripts. This article describes how to integrate Python scripts, what they enable, and what to keep in mind.
Preparation is half the battle: Basics and prerequisites
Not surprisingly, the basic prerequisite is installation of Python. Furthermore, you must have installed at least the Pandas and Matplotlib packages. In the virtual environment as well as the console, this is done with
pip install <package name>
Once all packages have been installed, the Python interpreter to be used can be specified in Power BI. This is done via File à Options à Python Scripting
Excursion: Would you like to learn more about the most important Python packages in the data environment and their application? Then click here to take a look at a blog post by my colleague Stefan Seltmann.
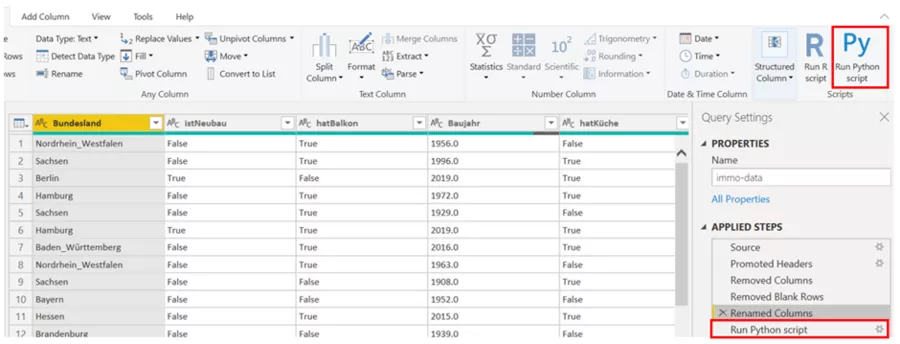
Python scripts in the query editor
Power BI basically offers two ways of integrating a Python script into data queries.
- Possibility 1: Definition of a Python script as a data source - any required steps can be taken here. A Pandas DataFrame must be passed at the end.
- Possibility 2: Definition of a Python transformation step
Here too, the data interface is realized here via Pandas DataFrames. The following example shows how to perform a transformation with Python. This example involves use of a data record of rental real-estate throughout Germany, including specific attributes such as the residence's size and number of rooms. Please note: This example is meant to illustrate how Python is integrated into Power BI. It has been deliberately kept simple in order to retain this focus. The usual model performance optimizations have been dispensed with.
To be loaded as a transformation step is an existent machine-learning model which forecasts the expected rent on the basis of these attributes.
Once all the preceding steps have been performed in the query editor, the Python script can be selected as the transformation step.
The Python code for the desired transformation is approximately as follows:
# 'dataset' holds the input data for this script

import pickle
import pandas as pd

# Definieren der Features für das Machine-Learning Modell
feat_columns = ["Bundesland", "Alter", "Wohnraum", "Anz_Zimmer", "hatBalkon", "hatAufzug", "hatGarten"]
features = dataset[feat_columns]

#Mappen des Bundeslandes von Reihen- in Spaltendarstellung
dummy_regions = pd.get_dummies(features["Bundesland"])

for dummy in dummy_regions.columns:
    features[dummy] = dummy_regions[dummy]

features = features.drop("Bundesland", axis=1)

# Laden des Machine Learning Modells
model = pickle.load(open("<Pfad>/xgboost_model.pickle.dat"))

# Erstellen der Mietpreis-Prognose in neuer Spalte "Kaltmiete"
dataset["Kaltmiete"] = model.predict(features)

# Entfernen der nicht benötigten DataFrame Objekte
dummy_regions = None
features = None
Transformation comprises the following steps in Python:
- First of all, the pandas and pickle packages are loaded.
- Defined next are the features which the model needs to forecast rent. For this purpose, the format of the federal states is changed.
- After that, the model is loaded with pickle.
- The machine learning model forecasts rental prices for the entire data set.
- Deleted finally are all DataFrames which do not need to be available in Power BI. This avoids unnecessary data transmission.
Once the script has been applied, a data table extended by a column titled "Basic rent" becomes available.
Python scripts as visuals
If you want to use special plots or significantly influence your visual's design, creating these plots directly in Python can by all means prove useful. The language offers numerous libraries such as Matplotlib or Seaborn covering a wide range of different plots. These are individually configurable, and can be designed in terms of size, colour and shape according to your own wishes.
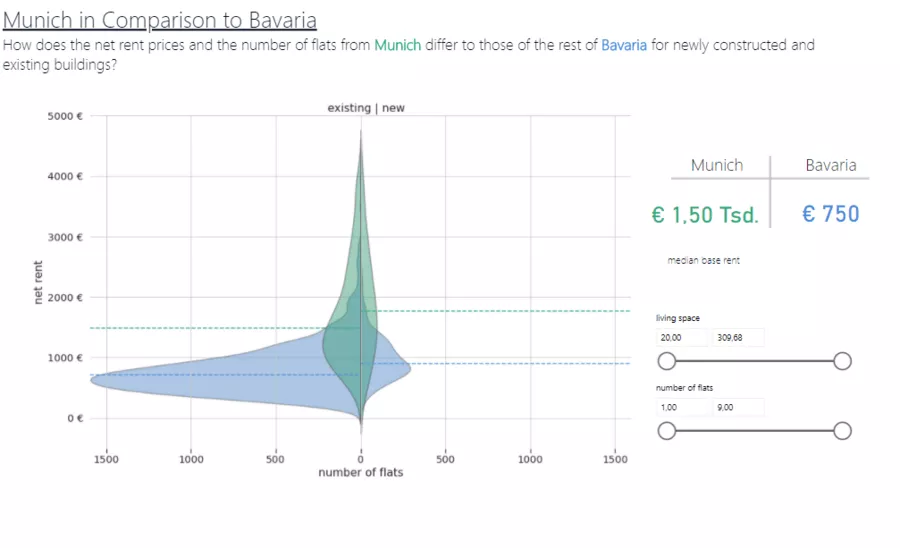
To demonstrate this, we use the real-estate data set to compare rents in Munich with those in the rest of Bavaria. For this purpose, we create the violin plot shown below; it shows the entire price distribution for Munich and Bavaria, while distinguishing between new and old buildings.
To create a diagram with Python, select Python Visual. Unlike the Python transformation, it is necessary here to add all columns related to the values needing to be available in Python.
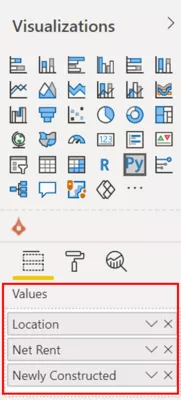
The Python script provides a Pandas DataFrame object with the defined columns. We will use Seaborn to create the violin plots.
The code for creating violin plots is generally as follows:
# dataset = pandas.DataFrame(Ort, Kaltmiete, istNeubau)
# dataset = dataset.drop_duplicates()

# Paste or type your script code here:
import seaborn as sns
from matplotlib import pyplot as plt
import numpy as np

# anpassen der Schriftgröße und des Plot Designs
sns.set(font_scale=1.3)
sns.set_style("whitegrid")

# Unterscheidung zwischen München und Rest Bayeren in einer neuen Spalte "Kategorie"
mask = dataset["Ort"] == "München"
dataset["Kategorie"] = np.where(mask, "München", "Rest Bayern")

# Erstellen und zeichnen des Plots
ax = sns.violinplot(x="Kategorie", y="Kaltmiete", hue="istNeubau", inner=None, data=dataset, split=True, scale="count")
plt.show()
What else is there to know?
Publishing reports with Python script
The procedure described so far applies to Power BI Desktop. However, Power BI reports are typically published with Power BI Service after having been created. This means that the built-in Python scripts will no longer run locally, but on Power BI Service. The Python version installed here can therefore differ from the local version. A list of all currently supported packages can be found here. (Diese Verbindung fuehrt zu einem deutschsprachigen Beitrag)
If a Python script is used as a transformation step or data source in the query editor, and needs to be automatically applied to an updated record, a PersonalGateway must be used. Python and the corresponding packages must be installed on the machine hosting the gateway.
Python and large data sets
The interface for data transfer between Power BI and Python is based on exchange of a temporarily generated CSV file. This must be created, saved and re-read on every update. You should therefore be careful not to load more data than necessary to Python. From a certain data size onward, you should avoid Python scripts.
Conclusion
Before integrating Python into Power BI, you should check whether the desired objective could also be achieved with ready-made, more efficient Power BI solutions. It is also necessary to consider how the reports should be published, and whether the necessary Python script is fully supported then. If Python can be used, it offers tremendous possibilities of adding functions to Power BI and creating individual plots with unlimited scope for design.
Do you have specific questions about this procedure, or would you like to exchange information about Python in Power BI? Then don't hesitate to contact us!