
Congratulations, you’ve managed to get through previous sections of our reference architecture model unscarred! The most tedious and cumbersome part is behind us now. However, it’s no problem if you're just getting started with part 3 of our blog series! Simply click on the links to part 1 and part 2, where we take a closer look on ingestions and data lakes as well as the entire reference architecture.
The data warehouse is ultimately the single source of truth across your organization, and the service most of your users access daily. Offerings from major cloud providers cover self-managed to serverless solutions. While the final choice depends on your environment, we tend to lean towards serverless solutions, which offer significantly lower maintenance requirements and better integration with other services in the cloud provider's ecosystem. In our data warehouse service, we usually look for features like ANSI SQL support, stream/batch ingestion, in-memory capabilities, AI/ML framework integration, column-/row-level security, automatic backup and restore, high availability, scalability, uptime SLA, etc. The winners differentiate themselves through streamlining of data ingestion, setup complexity (table retention or dataset access permissions), and by offering a rich set of features built around the data warehouse service.
Make data visible
Data visualization tools come to the rescue by bridging the gap between low-level data management topics described above, and provide the ability to derive value from the underlying data. They allow a wide range of end-users to transparently access data (with all security and compliance rules applied), gain valuable insights, and build interactive dashboards that can also be shared across your organization. Through integration with the data warehouse service, data visualization tools effectively take advantage of low-level optimizations (like filter push-down), thus reducing the amount of data that must be moved around. Also, data visualization tools strive to simplify and modernize end-users’ work with data at scale, through features like data discovery, data cataloging, rule-based alerts, scheduled reporting, git workflows for collaboration, and more.
The AI/ML platform comes into play, as soon as we start thinking about advanced use cases like recommendation engines, dynamic pricing, and fraud detection. As a data scientist, you want to prepare and preprocess data, and then develop, train, test, and deploy your models. This workflow needs to be as simple and streamlined as possible, so that your AI/ML teams can deliver the newest models quickly. In other words, no more one-off VM instances without proper metadata tags lying around, and manual data ingestion/exports from obscure local data sources. Additional capabilities that further enhance a data scientist's toolbox include labeling datasets, use of prepared or custom VM images (custom AI/ML libraries), notebooks (Jupyter), and use of the AI/ML repository (think of sharing AI/ML components and pipelines between data scientists for improved collaboration). An AI/ML platform is evaluated in terms of seamless integration of all the above-mentioned features.
What’s underneath: Central Services
At this point, we have end-to-end data flow from our source systems to end-users, but we are still somewhat in the dark. Firstly, our users have no overview of the data stored on the platform, and thus lack the capability to quickly assess which datasets are relevant for their use case. Secondly, if any of the above components fail, our DevOps team lacks the capability to observe and debug. Thirdly, as we have unfortunately witnessed at too many organizations, infrastructure resources are deployed by hand, rendering concepts of automation and repeatability inapplicable.
Metadata management in the form of a data catalog remedies the first problem. Automated data discovery in cloud services (datasets in the DWH or persistent layer) helps to sync technical metadata. These can be extended with schematized tags for business metadata (PII and GDPR). We aim for a fully managed service with security and governance integration, and an easy-to-navigate UI that provides search and discovery capabilities for a unified view of data, wherever it may be (including support for on-premise datasets).
Nevertheless, it's only a matter of time before something goes south in our platform, a harsh reality for cloud services consumers. Despite SLAs provided for each service (remember, we've picked a handful of them already), the service might become unavailable temporarily, breaking our end-to-end data processing pipeline and causing issues downstream. For that reason, as for our on-premise system, we use monitoring tools for visibility into the performance, uptime, and overall health of the platform. By collecting metrics, events, uptime probes, application instrumentation, etc., we can generate insights via dashboards (pattern detection, exhaustion prediction) and, if needed, report anomalies through alerting. Next, cloud services generate a multitude of logs – platform-specific logs, and user logs (generated by our applications), and security logs (an audit trail of administrative changes and data accesses). For logging, we desire features like logs archival, retention and alerting, log-based metrics, custom logs, advanced analytics on generated logs, and third-party integration (exports to SIEM tools).

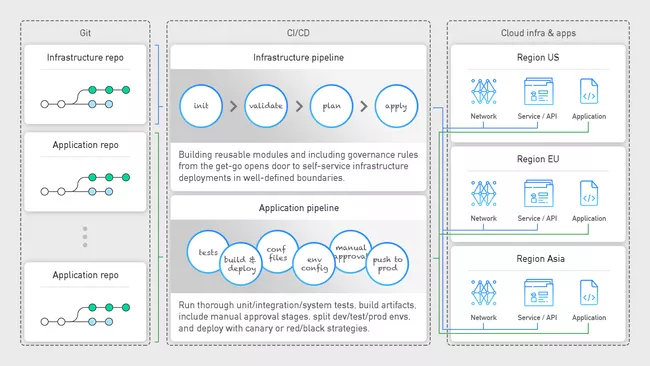
At this stage, let's stop for a moment and go back in time. Assume that after considerable deliberation, your organization has decided to migrate to the cloud. As soon as you are granted access, you log in to the console and, full of excitement, start using various services to create resources left and right. Red flags anyone? The keyword here is automation, from your infrastructure to your applications. Whether you manage the infrastructure for the whole organization or just your department, you should strive for consistency and repeatability. Only then can you rest assured that your DEV and PROD environments are consistent, and that any bugs or fixes can be quickly and consistently deployed across the environments. We can automate the complete process with CI/CD, meaning continuous integration and continuous deployment. The CI part handles the build & test phase of your infrastructure/application (running unit/integration/system tests, building a docker image and storing it in an artifact registry). The CD part is in charge of deploying the infrastructure resources/artifacts to target services (deploying the docker image to the Kubernetes cluster). By integrating this process with your version control (GitHub or GitLab), your developers can focus on implementation, knowing that pushing a git commit automatically starts a CI/CD pipeline and deploys the application – a practice known as GitOps.
Now that we have discussed individual building blocks of the reference architecture at a high level, our next blog in the series will delve into implementation on a Google Cloud Platform. Stay tuned and – if you hate missing out – remember to sign-up for our newsletter!