


With the Q2 2023 update titled "New optimized story experience – unified stories and applications", SAP analytics cloud offers users new ways to develop reports and dashboards even more flexibly and easily in an integrated design environment. We'll show you which new features the update provides and how it supports you in creating reports.
Unified Stories and applications
At the beginning of each report development, it is necessary to determine and decide whether the standard functions of stories should be used, or whether the advanced customization options of analytics applications are needed. Conversion was hitherto not possible, so that completely new development was always necessary.
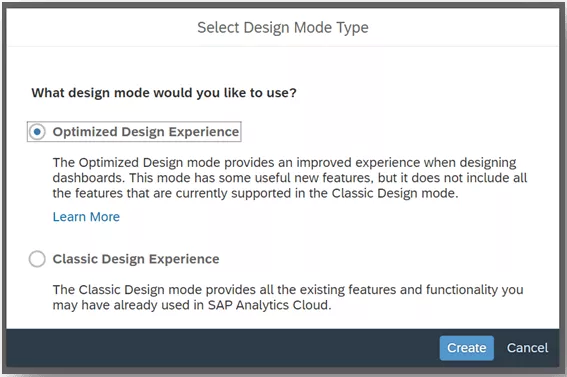
But this issue is now a thing of the past. Both report variants have been brought together in a central design environment - the optimized design experience - and the advantages of stories as well as analytics applications have been combined. All users can now develop reports and dashboards using a "design & extend" approach, and decide flexibly at any time whether or not they want to use individual coding. It is still possible to design reports and dashboards in the classic design experience, although SAP recommends using the new, optimized design experience.
Advanced mode
The biggest advantage of the new optimized story experience is the ability to produce everything in a single environment including a report artifact. All users, whether designers or developers, can now collaborate via this design environment and its report artifact. Accordingly, there is no longer any need to differentiate beforehand between story and analytics application; thanks to an advanced mode, a story can be extended at any time with the functions of an analytics application. This makes development in the SAC more flexible and easier than ever before.
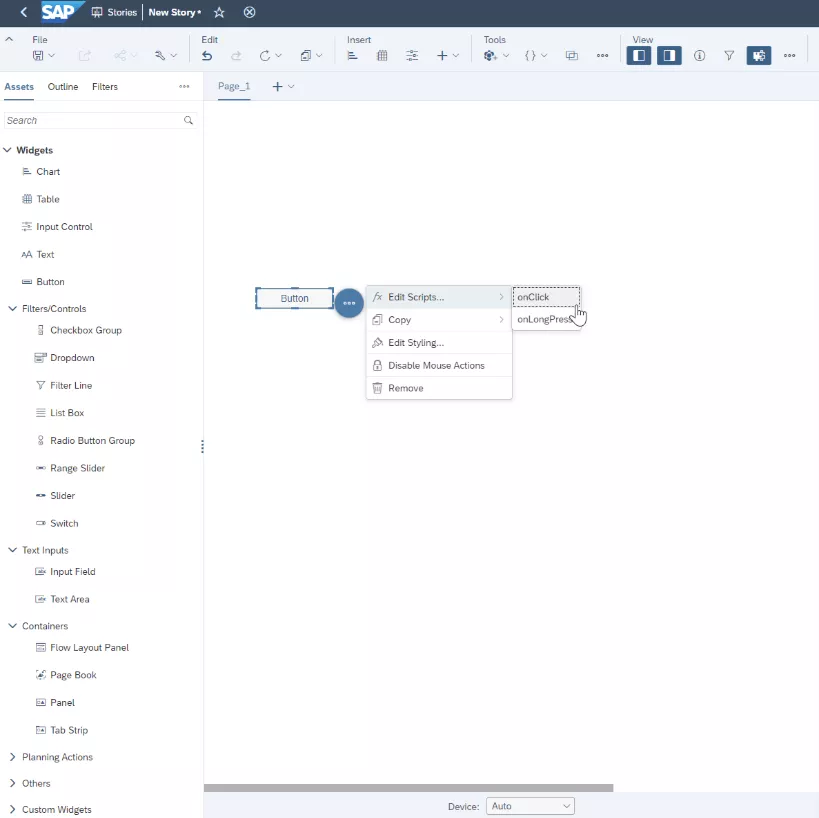
In the advanced mode, users can extend their story with individual coding as well as technical objects from analytics applications. Technical objects from analytics applications include, for example:
- Buttons
- Drop-down menus
- Sliders
- Containers
- Radio buttons and checkboxes
If required, a story can be extended on-the-fly with the scripting functionality of an analytics application. If no script functions or technical objects are required, the mode can be deactivated with one click in the tool menu, and the standard functions of stories can continue to be used. The advanced features can be activated or deactivated at any time.
"Design & extend" approach
The "design & extend" approach involves first designing a report with suitable visualizations and then extending it with individual coding if necessary. For this purpose, the simple design of stories is supplemented by flexibility through the use of individual coding from analytics applications.
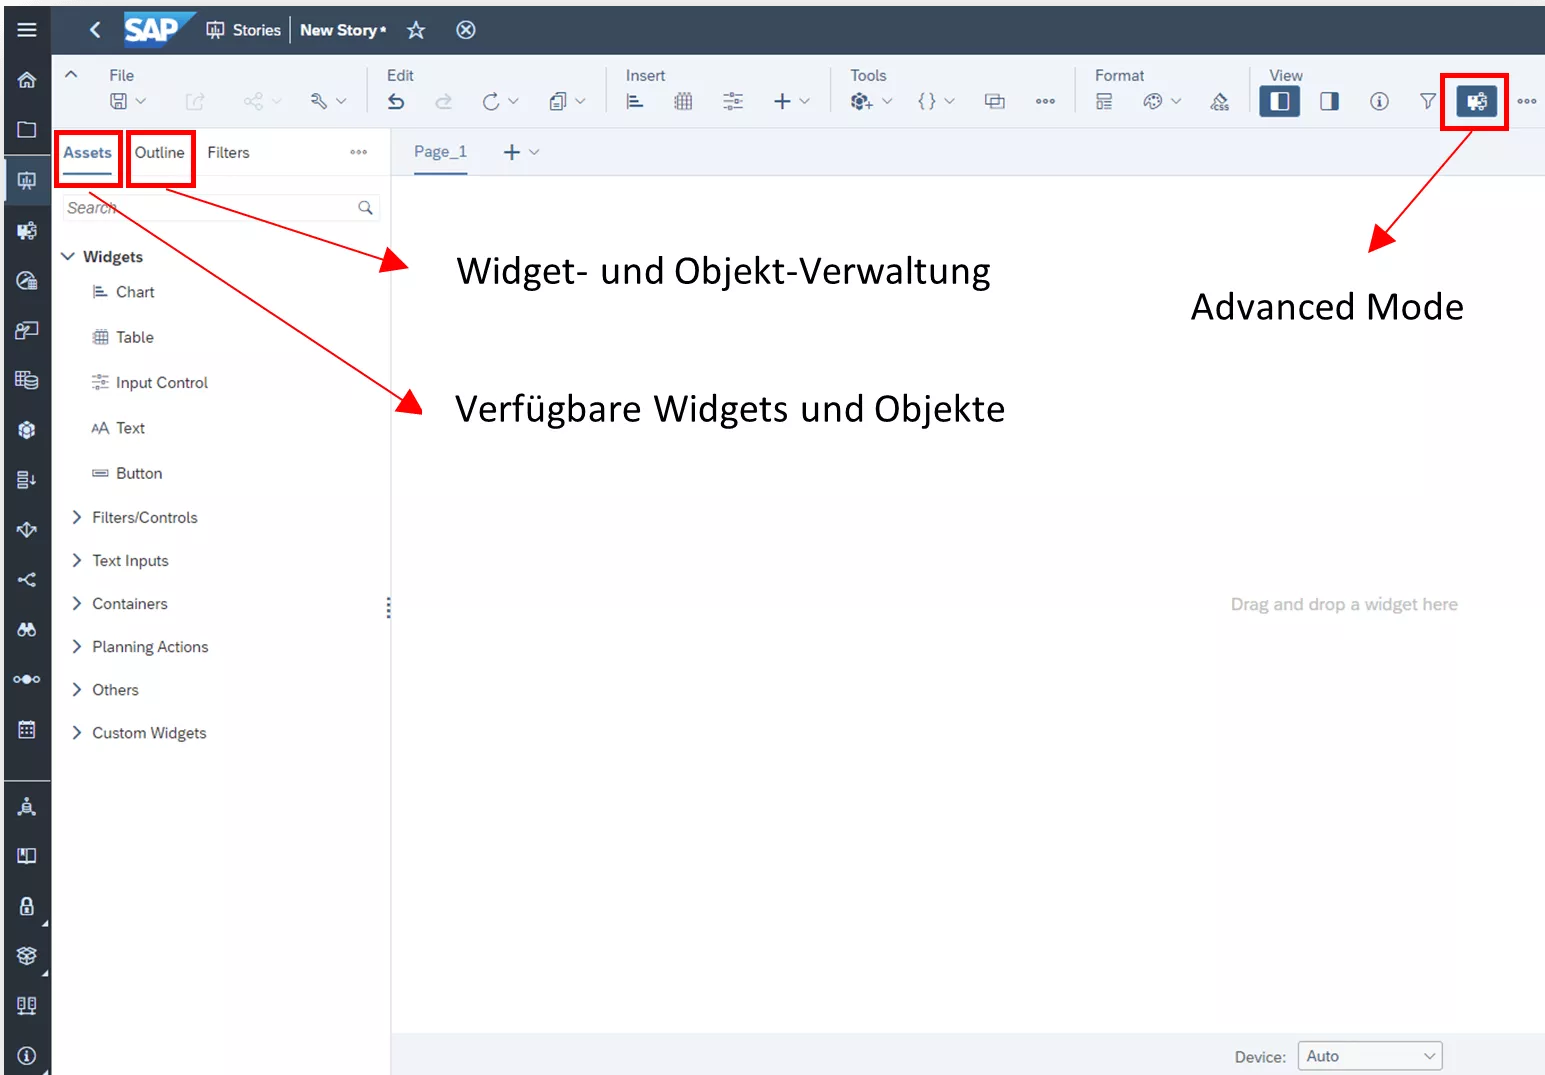
The new way of creating reports combines the familiar interfaces of stories and analytics applications in an integrated design environment. On the left-hand side, the functional design panel from the analytics application's environment has been taken over and divided into three sub-panels. Their respective functions are briefly described next:
- Assets panel: This panel provides an overview of all available widgets which can be inserted into the story canvas via drag-and-drop. New here are technical objects such as buttons, drop-down lists, containers and much more, which can be used when the advanced mode is active on the toolbar.
- Outline panel: This panel provides a structured overview of all currently used widgets and helps manage them. For example, widgets can be shown / hidden, locked or extended with code. A new feature here is locking of widgets to prevent them from being moved.
- Vertical filter panel: This new panel makes it possible to manage global filters, variables and user input via a vertical menu. SAP offers users more flexibility here by allowing global filters to be displayed either vertically or, as before, horizontally.
Conversion of old reports
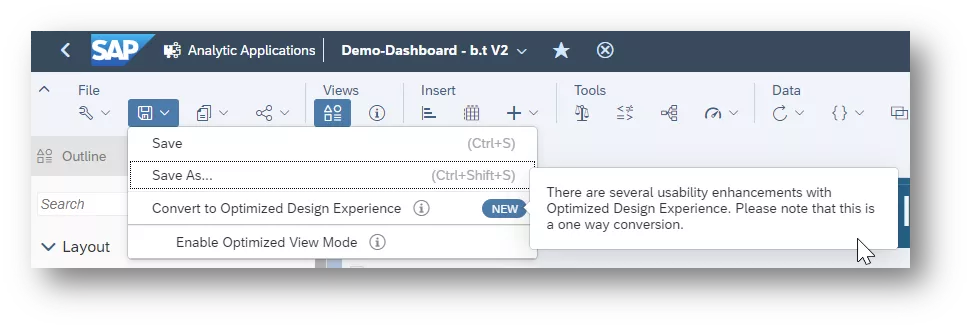
It is also possible to convert previous stories and analytics applications for the new design experience. Reports created with the optimized design experience before the update receive this update automatically and require no more action. Stories and analytics applications developed with the classic design approach can be converted. Users can find the conversion function in the tools menu via:
- Save icon
- Convert to optimized design experience
- Popup with more information and links
- Convert button
Some limitations need to be borne in mind when converting from classic to new reports. These include:
- Examine: Not supported
- Predictive forecast (in tables): Not supported
- Explorer: Replaced by data analyzer
- Grid pages: Not supported, to be replaced with table widgets
- Legacy-value driver tree: To be replaced with value-driver tree widget
- Control panel: Replaced by filter panel
Most of the features above have been superseded, and are no longer supported or recommended by SAP in their previous form.
Unsupported areas and applications:
- Digital boardroom
- SAP data sphere integration
- Search to insight (global search)
Unsupported model types:
- Live universe
- Unauthorized data models
- Live SAP HANA models with load parent-child hierarchies independent of metadata
You can find out more about optimized story experience restrictions and limitations here.
If you would like to know more about developing reports and dashboards in the SAP analytics cloud, feel free to contact us. We provide support if you have any questions about the SAP analytics cloud, and also offer deeper insights with our SAC Workshops Dashboard in a Day and Coding Analytics Applications.